Are we doing enough to ameliorate the negative impact of race on minority groups in majority White societies?
To attempt to answer this I have analysed available data to plot how fast the gaps are closing between different groups across the metrics that are tracked by public bodies.
If the gaps are vanishing before our eyes, a hypothesis that we are not doing enough will be refuted. If the gaps are not closing, or not closing within what we might consider a reasonable period, the hypothesis will stand further examination; how could these gaps be closed faster?
I have trawled various UK and US government websites and collated all the trend data I can find.[i]
United States

United Kingdom

I have focused on the UK and US because there is reasonable data available, searchable in my own language, and because both countries have played central roles in the development of the racial landscape that surrounds us.
The data is far from perfect; there are other indicators I would like to track but cannot find data over time for. But I am glad I can get this data at all; one can well imagine that more repressive states would not collect, or would restrict access, to this information.
To attempt to answer the question “How fast are the gaps closing?” I have taken the available data and plotted each minority group in relation to the national average. For example, the raw data on unemployment in the US looks like this;
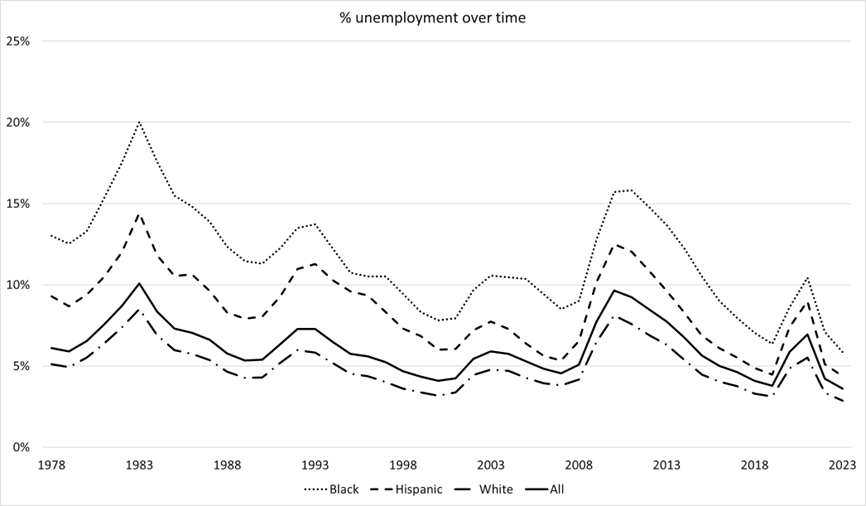
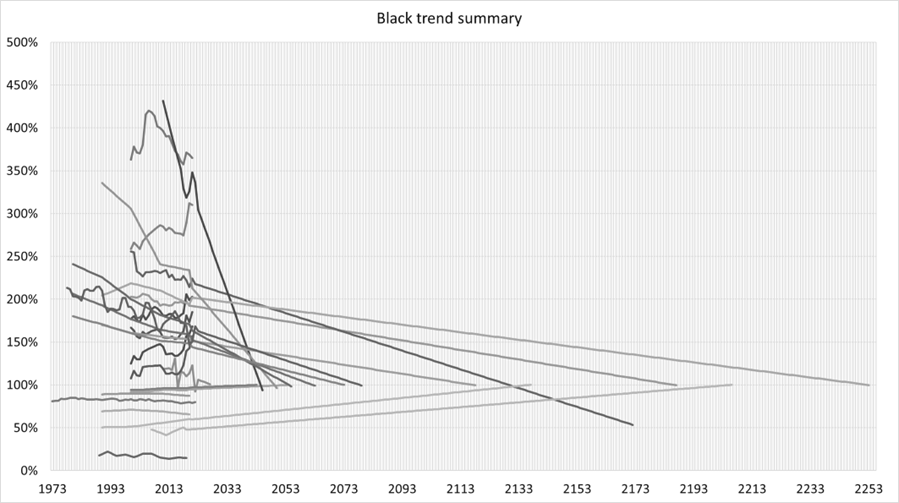
We can see the gap is closing; but how fast? By plotting the same data as a ‘Discrepancy Against All’ we can see the gaps closing more clearly. By adding a linear trend line we then see when Black and Hispanic groups would cross 100%; where parity with the average for all would be achieved; if the future continued in line with the past.

On this chart we see that the linear trend line for Hispanic people crosses in 2050 and for Black people it crosses in 2080.
This is not a forecast. We do not know if these gaps will close faster; or slower; than the historical trend line suggests.
What we can say is that this gives us a clear view of how well we have done so far; how well we are doing right now.
In total I have plotted 199 available data sets (91 from the UK and 108 from the US) to chart how fast the gaps are closing for different groups; and where they are not closing.
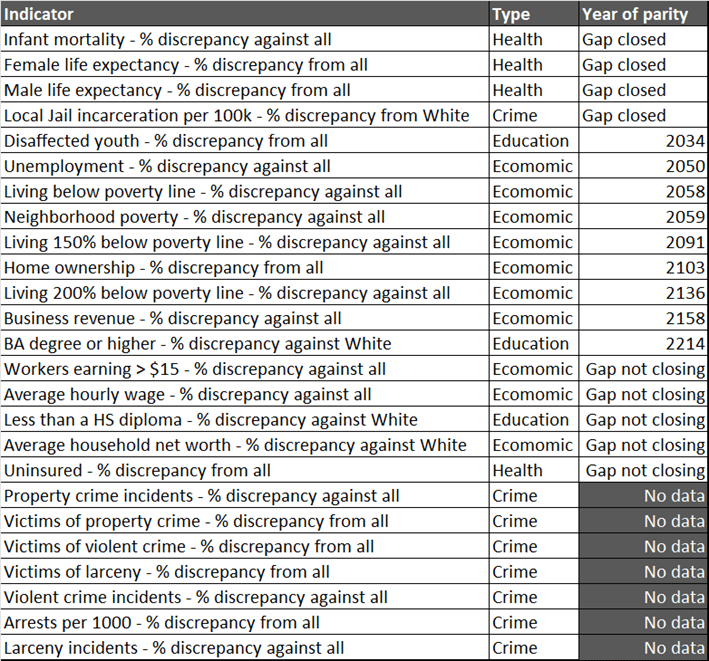
Having conducted this analysis, I then wanted to look at an overall picture for each minority group where data is available;
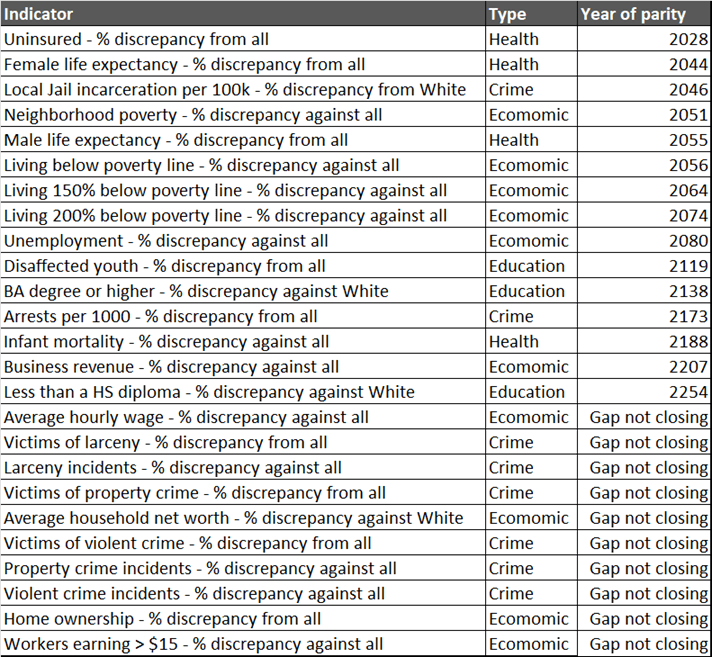
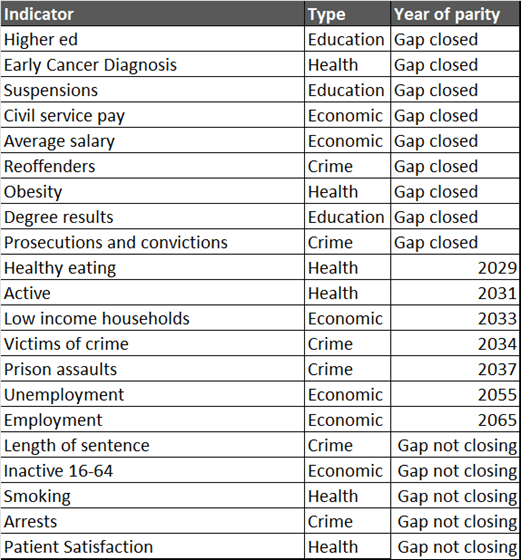
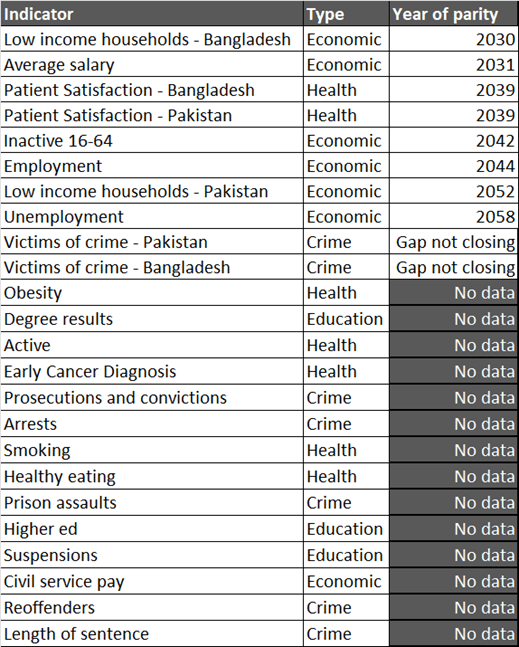
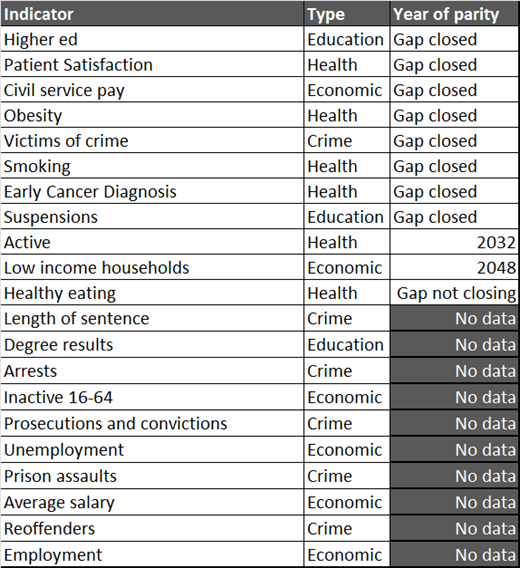
In order to make all this easier to read, I have converted the same data shown above, into a table format for each group.
The following pages show “Time to parity” for each of six US minority groups and six UK minority groups.
The questions I reflect on while reviewing this data are;
1. Is this an acceptable rate of progress?
2. If not, can we do better? Or do we think this is as good as it gets?
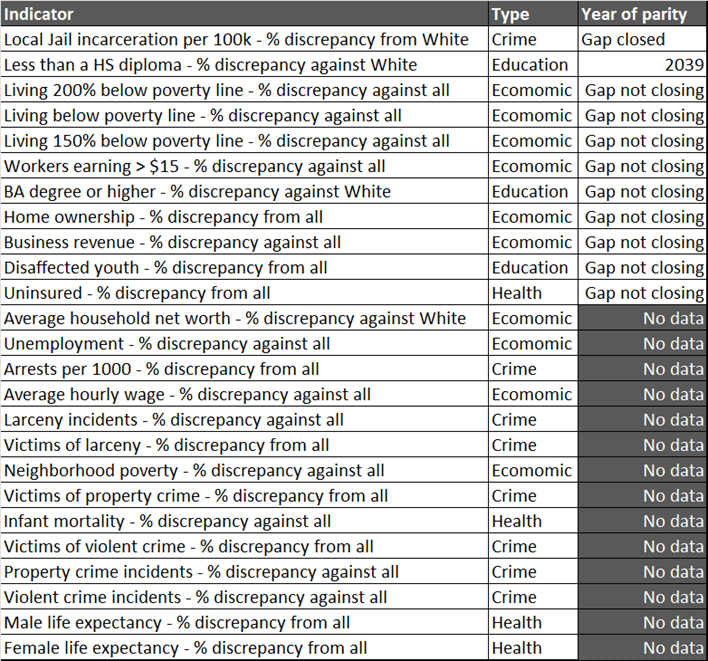
US – Black
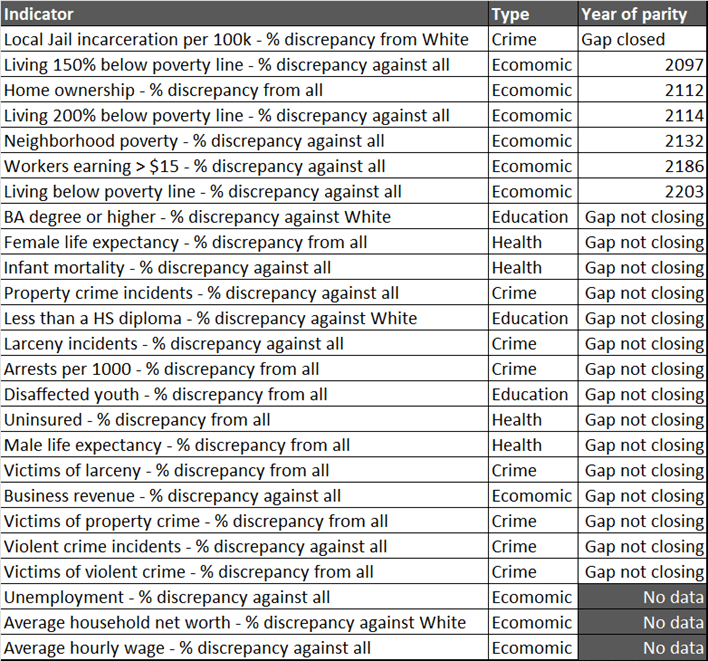
US – Latino
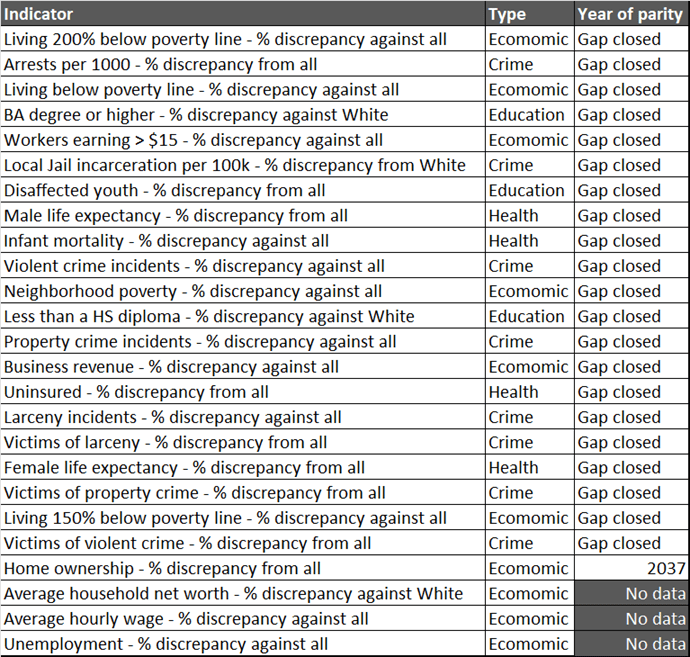
US – Native American
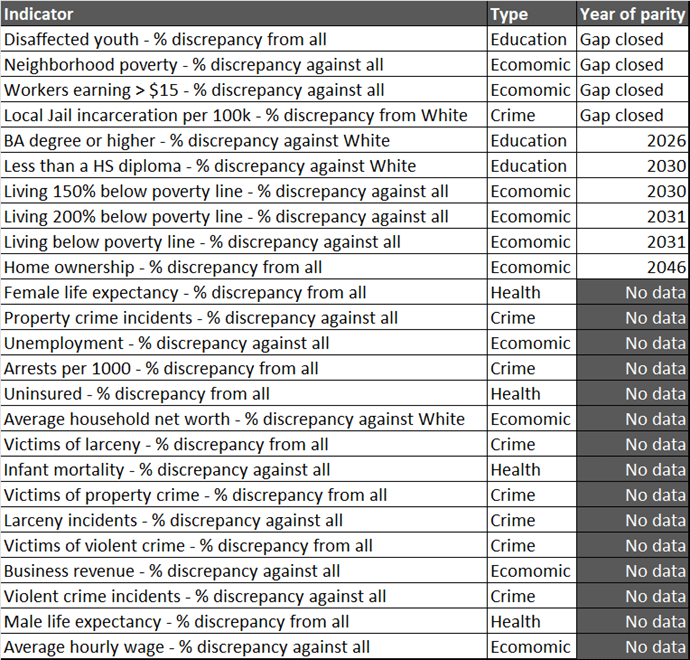
US – Asian
US – Mixed race
US – Pacific Islander
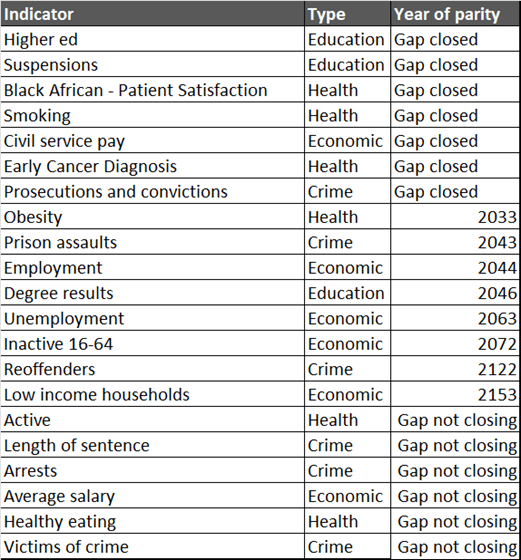
UK – Black
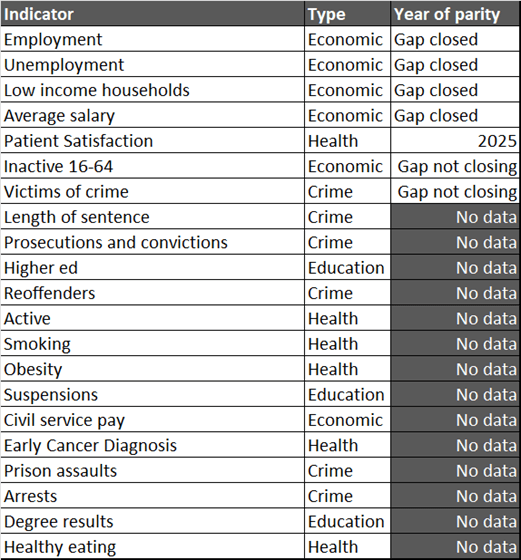
UK – Indian
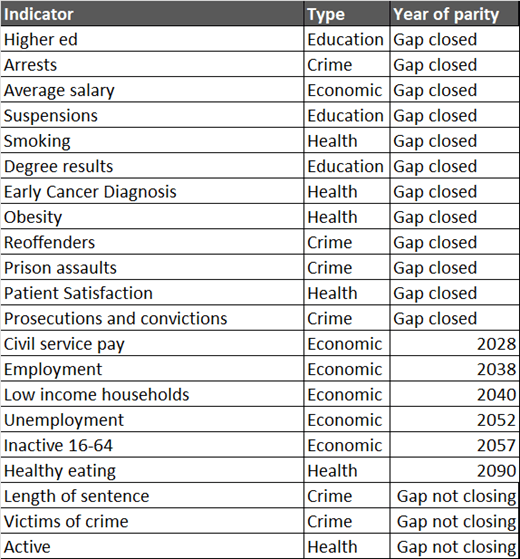
UK – Asian
UK – Mixed race
UK – Bangladeshi and Pakistani
UK – Chinese
Conclusions
Before focusing on what all this tells us, we should consider what these charts do not tell us; what we might be tempted to infer without cause. Behind this data are millions of human lives, all far more complex and unpredictable than any data can model.
It is not the case, for example, that Asian Americans are unhampered by racism. The data suggests that group has achieved or exceeded parity with the national average on most issues. But the metrics I show are a random selection I was able to gather trend data for. And the experiences of the individuals in that group will vary wildly from each other and the averages shown here.
Similarly, it is surely not the case that all Native Americans are condemned to a state of ubiquitous disadvantage. Despite most metrics not closing the gap at all, these are averages. The lives of the millions of people this data relates to will be diverse and are largely unknown to us based on a review of these tables.
It is also worth reflecting on all the data that is not available; for example, Romany and traveller communities in the UK are subjected to substantial prejudice but data has only recently started to be tracked; I was unable to model any meaningful trends from what was available. There are also lots of other groups in both the US and UK who are subjected to racial prejudice but do not feature at all in these lists; Jewish communities, Syrian refugees, Turkish communities and many more.
Having set out all these caveats; what can we take from the data presented? We can summarise the data from the last 12 pages thus;
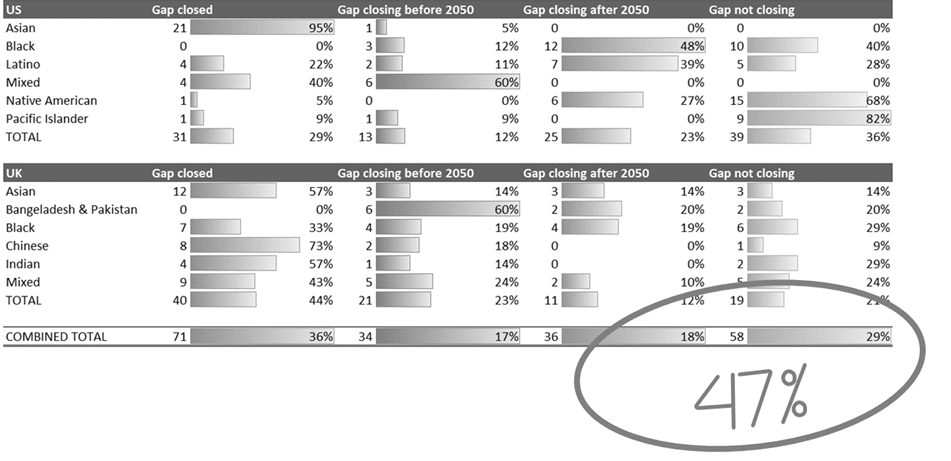
In total, out of 199 metrics across both countries, 94 (47%) reach parity after 2050 or not at all.
For the author, this answers the first question above;
1. Is this an acceptable rate of progress?
Answer – No. This is not an acceptable rate of progress.
The following chapters will explore the second question;
2. Can we do better; or do we think this is as good as it gets?
Do we do nothing, or something? If we do something, what do we do? Whatever we do it takes place in a world where the impact of race is profound, ubiquitous and ongoing.
[i] Arrests – Federal Bureau of Investigation Crime Data Explorer
https://cde.ucr.cjis.gov/LATEST/webapp/#/pages/explorer/crime/crime-trend
Incidents of crime – Federal Bureau of Investigation Crime Data Explorer
https://cde.ucr.cjis.gov/LATEST/webapp/#/pages/explorer/crime/crime-trend
Victims of crime – Federal Bureau of Investigation Crime Data Explorer
https://cde.ucr.cjis.gov/LATEST/webapp/#/pages/explorer/crime/crime-trend
Local jail – Bureau of Justice Statistics, Annual Survey of Jails, 2011, 2016–2018, 2020, and 2021; and Census of Jails, 2019.
Education attainment – IPUMS USA | National Equity Atlas
https://nationalequityatlas.org/
$15 per hour – IPUMS USA | National Equity Atlas
https://nationalequityatlas.org/
Home ownership – IPUMS USA | National Equity Atlas
https://nationalequityatlas.org/
Household net worth – Federal Reserve
Hourly wages – Economic Policy Institute, State of Working America Data Library, “Median/average hourly wages,” 1979-2023.
Data Library
Poverty – IPUMS USA | National Equity Atlas
https://nationalequityatlas.org/
Unemployment – Economic Policy Institute, State of Working America Data Library, “Unemployment Series,” 1979-2023.
Data Library
Neighbourhood poverty – IPUMS USA | National Equity Atlas
https://nationalequityatlas.org/
Business revenue – IPUMS USA | National Equity Atlas
https://nationalequityatlas.org/
Infant mortality – IHME
https://www.healthdata.org/research-analysis/health-by-location/united-states
Life expectancy – IHME
Health Insurance – US Census bureau
U.S. Census Bureau. “SELECTED CHARACTERISTICS OF HEALTH INSURANCE COVERAGE IN THE UNITED STATES.” American Community Survey, ACS 1-Year Estimates. Accessed on October 4, 2023.
All UK data – Cabinet Office
https://www.ethnicity-facts-figures.service.gov.uk/
[1] https://www.un.org/en/about-us/universal-declaration-of-human-rights
[2] (Kendi, How To Be An Antiracist, 2019, p. 47)

Leave a comment